In the intricate web of global trade, the Suez Canal and the Panama Canal stand as vital conduits, facilitating the seamless flow of goods and commodities between Asia and the United States. For decades, these historic waterways have served as indispensable arteries for the maritime industry, accommodating the passage of immense volumes of shipping lines traversing vast distances with unparalleled efficiency.
By taking the direct route, goods can reach their destination faster compared to other methods of air or land transport. This water route provides a convenient option for businesses to manage their international shipments, reducing travel time by up to 42%. According to (Ismailia, 2024), a rough number of 26,434 shipping lines traveled through the Suez Canal, an average of 72 shipping lines per day.
It serves as an efficient pathway for companies looking to expedite their shipping processes and streamline logistics. Particularly, the routes connecting Asia to the USA through the Suez and Panama Canal have emerged as lifelines for international commerce, catalyzing unprecedented growth in trade and shaping the dynamics of global supply chains.
In previous years, the Suez Canal and Panama Canal stood as leading shipping routes, prized for their reliability and cost efficiency. However, recent political disruptions and natural calamities have significantly altered this landscape. These developments pose formidable challenges to shipping lines, necessitating careful navigation through these routes to maintain revenue streams while mitigating escalating transportation costs. (Geneva, 2024)
In the ensuing discussion, we’ll look at the problems each shipping route is dealing with and check out the recent events that are making it hard to predict how much shipping routes will cost.
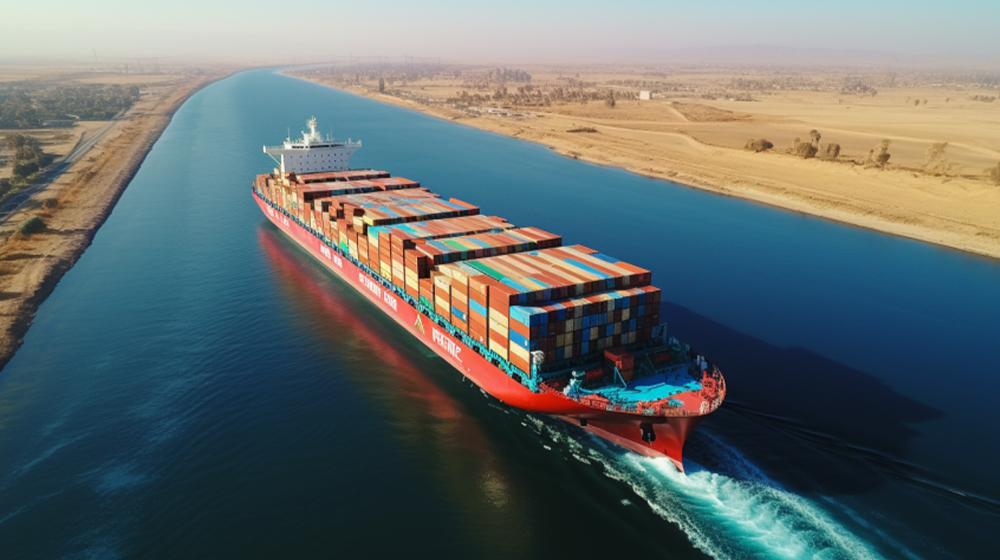
THE SUEZ CANAL
The container shipping industry is currently facing significant challenges due to the decreasing practicality of using the Suez Canal as a primary route for cargo transportation. (BISHOP, 2024) In December, two leading freight companies, including MSC, the largest container shipping line globally, decided to bypass the Suez Canal.
This move comes in response to intensified attacks on commercial ships in the Red Sea by Houthi militants from Yemen. The Iranian-backed Houthi movement in Yemen has escalated attacks on vessels in retaliation for the Gaza conflict. These attacks affect a crucial trade route that facilitates East-West commerce, particularly oil, by using the Suez Canal to avoid the lengthy and costly journey around Africa. Consequently, war risk insurance premiums have increased.
The Houthis, who control significant parts of Yemen, have vowed to persist with their attacks until Israel ceases its offensive on Palestine. Although they claimed to target only vessels bound for Israel, data from the ship tracking and maritime analytics provider MarineTraffic revealed that both the Palatium III and another MSC ship threatened, the Alanya, were en route to Jeddah, Saudi Arabia. Bab al-Mandab is a vital route for international maritime trade, particularly for shipping crude oil and fuel from the Gulf to the Mediterranean via the Suez Canal or the SUMED pipeline, as well as for commodities heading to Asia, including Russian oil. The surge in war risk premiums for the Red Sea results in additional costs amounting to tens of thousands of dollars for a seven-day voyage for shipping lines. Similarly, this cost is transferred down by shipping lines to the forwarders and buyers and they push the cost to the end consumer by adding more value to it’s price. (Reuters, 2023).
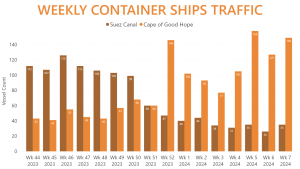
Let’s have a look at AXSData about the weekly vessel traffic through the Suez Canal and it’s alternative route, the Cape of Good Hope.
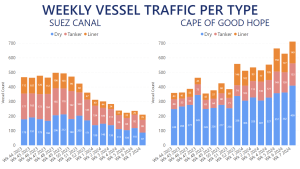
Four months into the officially recognized start of the Red Sea crisis, weekly merchant vessel traffic through the Suez Canal has decreased by approximately 55%. Concurrently, the number of Dry Bulkers, Tankers (including Gas Carriers), and Container Ships navigating the Cape of Good Hope has surged by up to 98%.
According to AXSInsights data, the crisis has impacted the three primary vessel markets differently. Liner vessel traffic responded to the situation in the Bab al-Mandab Strait as early as November of last year, whereas the numbers of Dry Bulkers and Tankers using the Suez Canal were influenced a few weeks later.
Container ships experienced the most significant decline in traffic through the Suez Canal, with only 26 vessels crossing in either direction during the second week of February. This marked a historic low, previously seen only once in the past decade when the MV EVER GIVEN blocked the canal in 2021. This figure also represented a 76.1% decrease compared to last year’s period, further exacerbating the already substantial 64.4% year-over-year decline in container ship traffic recorded in January.
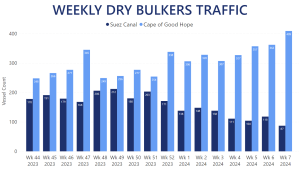
The Dry Bulk segment has been the least impacted by the Red Sea crisis in percentage terms. While container ships were quickly rerouting via the Cape of Good Hope, Dry Bulk cargo vessels hit a record 212 crossings through the Suez Canal in the first week of December 2023, with high traffic levels continuing throughout the month. However, January 2024 saw a year-over-year decline of 18.4% in Dry Bulk vessel crossings. This drop became even more pronounced in early February, with a year-over-year decrease exceeding 55%.
The relatively slow reaction of the Dry Bulk market segment can be explained by the fact that iron ore, the most commonly transported Dry Bulk commodity, is mainly shipped to China from Australia or Brazil, typically via the Cape of Good Hope. Unlike Tankers and Container Ships, Dry Bulkers usually have more vessels navigating the Cape than the Suez Canal. Nonetheless, since the start of 2024, traffic around Africa’s southernmost point has increased by over 120.4% year-over-year.
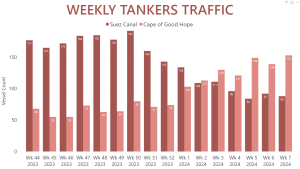
Tanker vessels, including LNG and LPG carriers, maintained a consistent presence through the Suez Canal until mid-December last year, with up to 192 ships passing through in a week. However, over the past nine weeks, Tanker traffic has decreased by more than 55%, with just over 80 vessels crossing in the first week of February. January’s overall traffic saw a year-over-year decline of 35.2%, nearly erasing the growth observed following Russia’s full-scale invasion of Ukraine in 2022.
Meanwhile, the number of Tankers rerouting around the Cape of Good Hope has surged, reaching a peak of over 150 vessels recorded just last week. It’s important to note that this count excludes VLCCs, as they cannot pass through the Suez Canal when fully laden, which would distort the statistics. Nevertheless, these largest Tankers in the ocean contribute an additional 30 to 50 vessels per week to the overall traffic via the Cape of Good Hope.
The Red Sea crisis significantly impacted Container Ships due to its disruption of key global shipping routes. Rerouting of lines such as Asia-Europe, Asia-Mediterranean, and certain Asia-US East Coast routes exacerbated the situation.
Unlike Dry Bulk and Tanker operators, Container Ship operators handle cargoes for numerous clients, increasing the complexity and risk of their voyages.
The decline in weekly passages through the Suez Canal for Container Ships became noticeable in late November 2023, with traffic decreasing by almost 80% over thirteen weeks.
Conversely, Container Ships increasingly opted for the Cape of Good Hope route, with over 115 vessels passing through per week on average since the start of 2024. Peak traffic via the Cape reached nearly 160 vessels in the first week of February, marking a significant 222.4% increase over the weekly average before the Red Sea crisis. (Nearly 300 Less Ships Per Week Through Suez Canal Due To Red Sea Crisis, 2024).
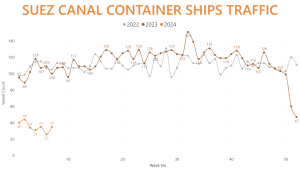
Container ship traffic through the Suez Canal experienced a significant decline due to the Red Sea crisis, starting earlier and dropping more sharply compared to Dry Bulkers and Tankers. This decrease began noticeably in mid-December 2023. By the second week of February 2024, the number of container ships passing through the canal had plummeted by 76.2% compared to the previous year. Since the beginning of 2024, there has been an average weekly decrease of 65.3% in container ship traffic. This drop has resulted in historically low numbers of container ships using the canal.
THE PANAMA CANAL
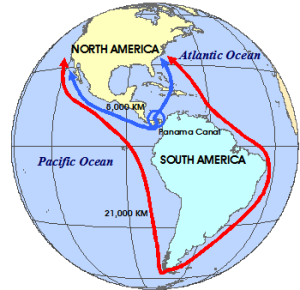
The Panama Canal was constructed to alleviate the significant inconvenience of shipping goods from San Francisco to New York or Tokyo to London by circumnavigating South America. This canal drastically reduces the journey by nearly 8,000 miles, saving considerable time and expense for maritime transport.
The French initiated the Panama Canal project in 1881 but abandoned it due to severe engineering challenges and high worker mortality rates. The United States, led by the determined President Teddy Roosevelt, resumed construction in 1904 and completed the canal by 1914. The total expenditure was $921 million, which is equivalent to nearly $10 billion today. In terms of the proportion of GDP at the time, this amount would be comparable to the U.S. spending $119 billion today.
While the Panama Canal is widely known, many people are unaware of its operational details.
The Panama Canal’s lock system functions like a staircase, enabling ships to rise and descend in stages while remaining level. There are three steps up and three steps down. Completed in 1914, this system was considered one of the most remarkable engineering feats of its time. (Urban, 2016)
Here is a map illustrating the canal and the location of the locks, along with an animation demonstrating how the locks operate, with exaggerated heights for clarity.

Now let’s discuss the issue with the Panama Canal.
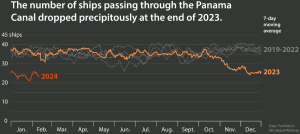
Recent drought conditions, exacerbated by El Niño and climate change, have significantly impacted shipping through the Panama Canal. Lower water levels in Gatún Lake led authorities to reduce the daily number of ship transits from 38 to 24 by November 2023.
This has caused long queues at nearby ports as vessels wait their turn. If these restrictions continue through 2024, up to 4,000 fewer ships—carrying goods such as children’s toys, solar panel components, and life-saving insulin—may pass through the canal. Such delays and disruptions are likely to become more frequent in a warming world. These seven graphics illustrate the serious threats drought poses to the global supply chain.
Drought:
Panama is experiencing an extended drought that started in early 2023 and continues unabated. October saw rainfall levels 43% below the average, marking the driest October since the 1950s. For the region surrounding the canal, 2023 ranks as one of the two driest years on record in the country.
El Niño-induced dryness, intensified by climate change:
Panama’s severe drought is being worsened by the combination of a strong El Niño and unprecedented global warming, with 2023 temperatures surpassing the pre-industrial average by 1.35°C. El Niño, a natural climate phenomenon, brings warmer air and ocean waters to the west coast of the Americas, varying in intensity and typically lasting between nine and twelve months. The National Oceanic and Atmospheric Administration (NOAA) forecasts that this El Niño will persist at least until April 2024.
The intensity of El Niño fluctuations is connected to climate change. Climate models indicate that the variations between El Niño and La Niña have become more extreme, leading to more frequent and intense events in recent decades. If high emission levels continue unchecked, El Niño events could become 15-20% stronger.
Gatún Lake levels continue to drop:
The drought has significantly impacted Gatún Lake, the artificial reservoir supplying water for the Panama Canal. On January 1, 2024, water levels in Gatún Lake were the lowest ever recorded for that month, nearly 6 feet lower than on January 1, 2023. Millions of gallons from Gatún Lake and other nearby lakes are used to fill the locks that lift ships above sea level for their journey across Panama. A lack of sufficient water threatens the canal’s operation.
Less water means fewer, smaller ships:
Due to decreasing water levels, the Panama Canal Authorities have implemented restrictions on ship traffic. Currently, only 24 transits per day are permitted until April 2024, when the authorities will reassess the situation at the onset of the rainy season. By the end of 2023, the number of ship passages had already dropped by 30% compared to normal levels. This unpredictability in Panama’s transit has led some ships to opt for alternative routes.
Decreased water levels pose limitations on the size of ships that can traverse the canal. Larger, heavier vessels, sitting deeper in the water, face an increased risk of grounding in shallower areas. Moreover, these large ships demand more lake water to elevate them within the locks. With the expansion of global shipping, fleets have increasingly relied on massive vessels capable of transporting larger cargo loads, despite the challenges they pose in navigating narrow water passages such as the Panama Canal. (Ruiz, 2024)