Microsoft Office is among the most widely used set of tools in the businesses around the world. Years of refinement and addition of features have made them essential for productivity in offices. Part of the suite, MS Excel is the go-to choice for employees working with numbers.
When starting out, Excel may seem overwhelming. Formulas, different options for formatting, etc can be confusing. With time however, you can learn useful tips and tricks to get work done faster and more efficiently.
Here are seven tips an office worker can use to impress their boss, or just to get work done in a better way.
1. Flash Fill
When entering an employee’s personal information, particularly their names, sorting out their first and second names one by one each takes a lot of time. The same is true for sorting out upper case and lower case entries for inventory as well. You can use the flash fill technique to save time with this. Here’s how:
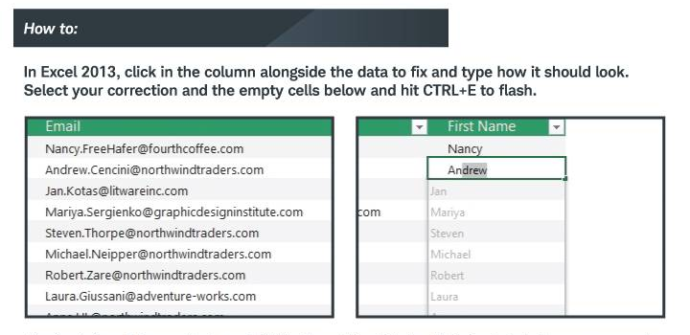
You can use this to manage mailing lists or to clear up messy databases.
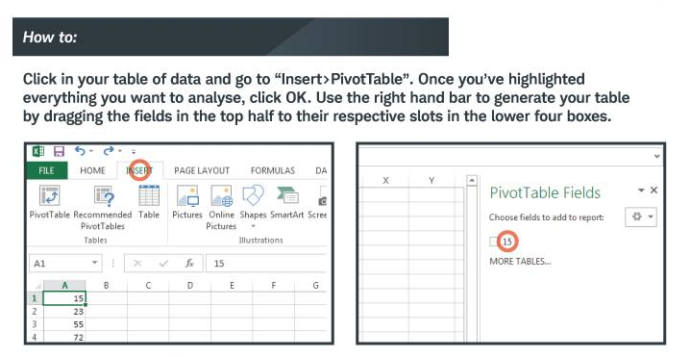
2. Pivot Tables
This tool is one of the easiest to use and has tremendous utility. This is due to the fact that it can summarize large amounts of data into tables and charts without entering a formula. They are especially useful in analysis charts or reports. This can also help a lot for research papers.
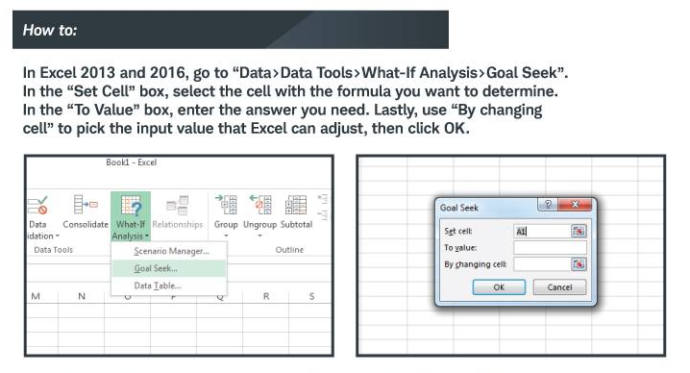
3. Goal Seeking
Sometimes you know what you’re looking for but don’t know how to get to it. This is true for Excel spreadsheets too unfortunately. To solve the problem “Goal Seek” is your friend and can do the necessary fieldwork for you. It tells you what numbers or figures to put in your Excel formulas to get the answer you’re looking for.
This can help with forecasting or setting targets.
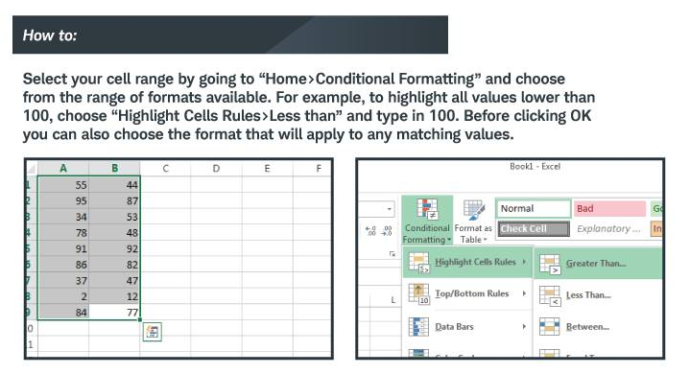
4. Conditional Formatting
Often times when showing your spreadsheet to your boss/manager, the results aren’t apparent until you take a closer look at all the values. With conditional formatting you can highlight the specific result(s) you want them to look at. This makes your spreadsheet easier to view from them as well (aside from scoring a few points from your boss about your MS Excel skills).
This coupled with Pivot tables is very useful for analysis based spreadsheets or reports based on a spreadsheet.
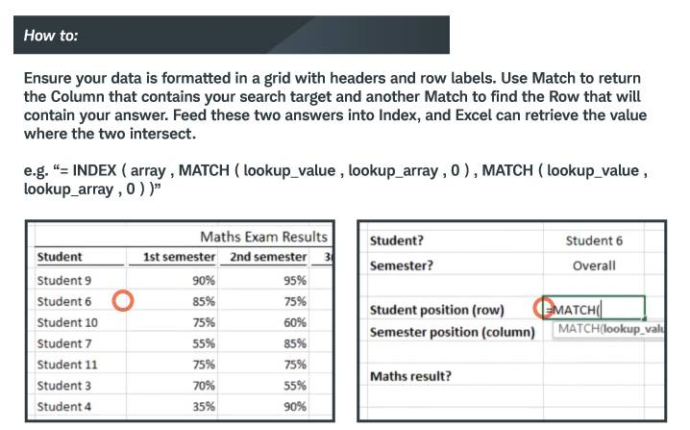
5. Index and Match
Using VLOOKUP is one of the basics of using MS Excel. The problem is that it only allows you to look through the first column of your table only. This can present a problem with tables with tens of columns. Index and Match is much more flexible and reliable for usage compared with VLOOKUP but it has a bit of a learning curve to it.
It looks complex and hard to understand at the beginning, but with time you can get quite adept at using this technique to look up info from a long list of records.
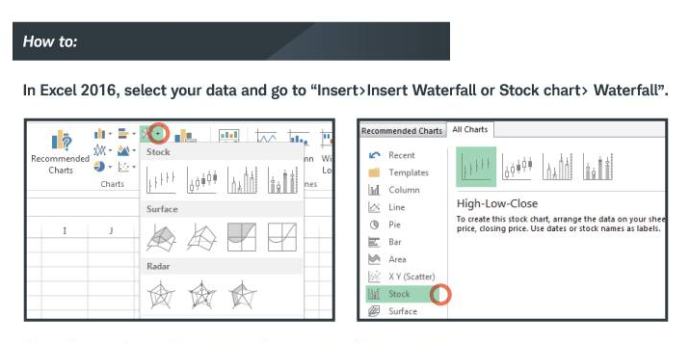
6. Waterfall Charts
This tip is for the financial analysts and statisticians out there. It helps you represent flow of data visually a lot better than regular charts. Representing stock market changes for a particular index or to show the net income/revenue of a large multinational company comes very easily with this tip. Performance reports are a breeze thanks to Waterfall charts.
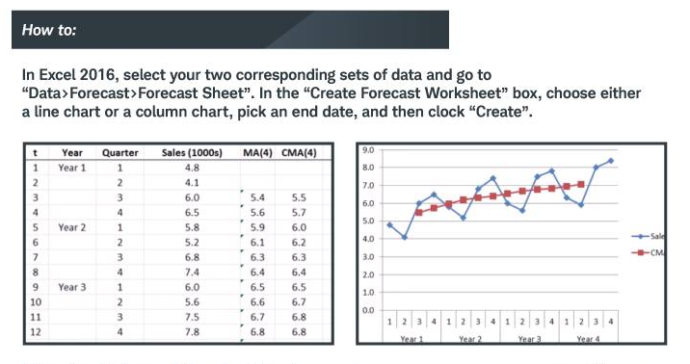
7. Forecasting
The 7th and final tip is also for financial analysts out there. This helps you show possible future values for your data based on historical data sets. In other words it looks at how the data changed over time and uses it to predict where it will go in the future.
It also allows you to include upper and lower confidence bands and margins of error. This is also useful for performance management for HR managers.
Do you know about other tips about using MS Excel better? Share them in the comments below.
Stay Connected with ProPakistani
Get the latest news, tech updates, telecom insights, and business stories wherever you prefer.
Add ProPakistani to Preferred Sources and see more of our stories in Google Search and Top Stories.


@HAAMIZ AHMED This Article would be tremendous, if Gif or video instruction given with each technique.
Yes it would be much more easier
Follow Asaan Hai …. Learning through Video and in our National Language
I am blind, a frequent reader of this site and user of
excel. The images incorporated in the articles are not read by my screen
reader. Please find an other way to present data which is shown in images. For
instance, here I can read the description of the tip but not what is put in the
image to further clearify the tip. Thanks
Sir, you are an inspiration.