Pakistan’s Consumer Price Index-based inflation witnessed an increase of 13 percent on a year-on-year (YoY) basis in January 2022, the highest inflation rate in two years as compared to an increase of 12.3 percent in the previous month and 5.7 percent in January 2021, says the Pakistan Bureau of Statistics (PBS).
In January 2020, inflation had risen to 14.6 percent.
On a month-on-month (MoM) basis, it increased by 0.4 percent in January 2022 as compared to a decrease of -0.02 percent in the previous month.
Economic analyst, A. A. H. Soomro, told ProPakistani,
This was expected. Next few months would be tough as well, given the low base and high energy prices. If PKR stabilizes and oil doesn’t rocket further, SBP may not need to tighten more and should wait to tide it our way. The 2HCY22 would be much better. Hopefully, FED tightening should relieve some pressure but the Russia-Ukraine crises are keeping commodities on cloud number 9.
CPI inflation Urban increased by 13.0 percent on a YoY basis in January 2022 compared to an increase of 12.7 percent in the previous month and 5.0 percent in January 2021. On an MoM basis, it increased by 0.1 percent in January 2022 compared to an increase of 0.3 percent in the previous month and a decrease of -0.2 percent in January 2021.
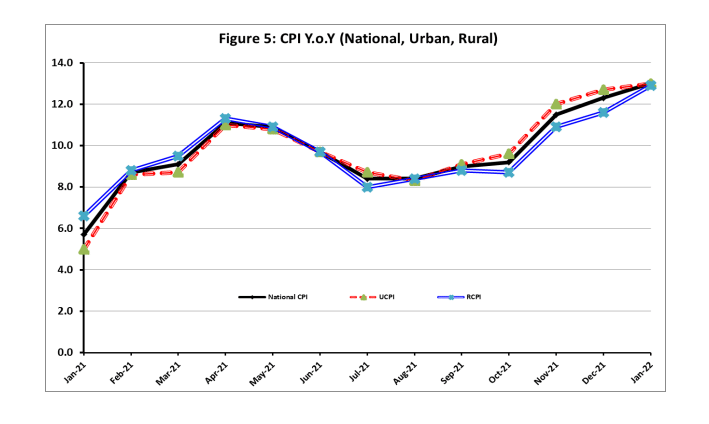
CPI inflation Rural increased by 12.9 percent on a YoY basis in January 2022 as compared to an increase of 11.6 percent in the previous month and 6.6 percent in January 2021. On an MoM basis, it increased by 0.9 percent in January 2022 as compared to a decrease of -0.5 percent in the previous month and a decrease of -0.3 percent in January 2021.
SPI inflation on a YoY basis increased by 20.9 percent in January 2022 as compared to an increase of 20.9 percent a month earlier and an increase of 7.7 percent in January 2021. On an MoM basis, it decreased by -0.8 percent in January 2022 as compared to a decrease of -0.4 percent a month earlier and a decrease of -0.8 percent in January 2021.
WPI inflation on a YoY basis increased by 24.0 percent in January 2022 as compared to an increase of 26.2 percent a month earlier and an increase of 6.4 percent in January 2021. WPI inflation on an MoM basis increased by 0.6 percent in January 2022 as compared to a decrease of -0.2 percent a month earlier and an increase of 2.5 percent in the corresponding month, i.e., January 2021.
Measured by non-food non-energy, CPI Urban increased by 8.2 percent on a (YoY) basis in January 2022 as compared to an increase of 8.3 percent in the previous month and 5.4 percent in January 2021. On an MoM basis, it increased by 0.8 percent in January 2022 as compared to an increase of 1.1 percent in the previous month and an increase of 0.9 percent in the corresponding month of last year.
Measured by non-food non-energy Rural increased by 9.0 percent on a YoY basis in January 2022 as compared to an increase of 8.9 percent in the previous month and 7.8 percent in January 2021. On an MoM basis, it increased by 1.2 percent in January 2022 as compared to an increase of 1.1 percent in the previous month and an increase of 1.1 percent in the corresponding month of last year, i.e., January 2021.
Measured by 20 percent weighted trimmed mean, CPI Urban increased by 10.6 percent on a YoY basis in January 2022 as compared to 10.8 percent in the previous month and 5.7 percent in January 2021. On an MoM basis, it increased by 0.5 percent in January 2022 as compared to an increase of 1.1 percent in the previous month and an increase of 1.0 percent in the corresponding month of last year.
Measured by 20 percent weighted trimmed mean Rural increased by 10.9 percent on a YoY basis in January 2022 as compared to 10.3 percent in the previous month and by 8.1 percent in January 2021. On an MoM basis, it increased by 1.1 percent in January 2022 as compared to an increase of 1.0 percent in the previous month and an increase of 1.2 percent in the corresponding month of last year i.e. January 2021.
- Main contributors to month-on-month and year-on-year percentage changes in urban CPI are given below;
MONTH-ON-MONTH: Top few commodities which varied from the previous month are given below:
FOOD
Increased: Pulse Masoor (6.13 percent), Gram whole (4.79 percent), Fruits (4.11 percent), Besan (3.82 percent), Pulse Gram (3.44 percent), Pulse Mash (3.37 percent), Wheat (2.68 percent), Pulse Moong (1.88 percent), Meat (1.78 percent) and Rice (1.28 percent).
Decreased: Tomatoes (42.88 percent), Potatoes (13.32 percent), Condiments & Spices (7.50 percent), Chicken (2.24 percent), Vegetables (1.65 percent), Wheat flour (1.28 percent) and Eggs (1.13 percent).
NON-FOOD
Increased: Woolen Readymade Garments (6.67 percent), Solid Fuel (5.16 percent), Hosiery (1.93 percent), Motor Fuel (1.75 percent), Cleaning & Laundering (1.59 percent), Washing soap/Detergents/Match Box (1.46 percent) and Liquefied Hydrocarbons (1.29 percent).
Decreased: Electricity charges (2.52 percent) and Construction Input Items (0.08 percent).
YEAR-ON-YEAR: Top few commodities which varied from the corresponding month of the previous year i.e. January 2021 are given below:
FOOD
Increased: Cooking Oil (54.33 percent), Vegetable Ghee (47.4 percent), Mustard Oil (46.68 percent), Pulse Masoor (41.3 percent), Fruits (28.35 percent), Gram Whole (24.7 percent), Meat (22.38 percent), Chicken (17.08 percent), Pulse Gram (15.67 percent), Beans (15.37 percent), Pulse Mash (12.46 percent) and Vegetables (11.58 percent).
Decreased: Tomatoes (41.95 percent), Pulse Moong (24.69 percent), Onions (4.39 percent) and Condiments & Spices (2.58 percent).
NON-FOOD
Increased: Electricity Charges (56.20 percent), Liquefied Hydrocarbons (53.35 percent), Motor Fuel (36.22 percent), Footwear (25.47 percent), Cleaning & Laundering (22.03 percent), Washing soap/Detergents/Match Box (17.95 percent), Motor Vehicle Accessories (14.04 percent), Woolen Readymade Garments (13.03 percent) and Plastic Products (11.72 percent).
- Main contributors to Month-on-Month and Year-on-Year percentage changes in Rural CPI are given below;
MONTH-ON-MONTH: Top few commodities which varied from the previous month are given below:
FOOD
Increased: Pulse Masoor (6.97 percent), Fruits (6.66 percent), Pulse Gram (4.55 percent), Gram Whole (4.43 percent), Pulse Mash (4.09 percent), Vegetables (3.64 percent), Eggs (2.69 percent), Pulse Moong (2.66 percent), Besan (2.25 percent), Meat (2.24 percent), Sugar (1.93 percent), Cooking oil (1.71 percent), Mustard oil (1.54 percent) and Rice (0.88 percent).
Decreased: Tomatoes (47.89 percent), Potatoes (12.74 percent), Onions (2.78 percent), and Chicken (0.47 percent).
NON-FOOD
Increased: Solid Fuel (6.65 percent), Cleaning & Laundering (2.90 percent), Woolen Readymade Garments (2.88 percent), Footwear (2.72 percent), Household Textiles (2.66 percent), Plastic Products (2.60 percent), Stationery (2.10 percent), Motor Fuels (2.03 percent), Washing Soaps/Detergents/Match Box (1.77 percent) and Hosiery (0.79 percent).
Decreased: Electricity Charges (2.52 percent) and Liquefied Hydrocarbons (0.19 percent).
YEAR-ON-YEAR: Top few commodities which varied from the corresponding month of the previous year i.e. January 2021 are given below:
FOOD
Increased: Cooking Oil (50.33 percent), Mustard Oil (49.73 percent), Vegetable Ghee (49.27 percent), Pulse Masoor (36.22 percent), Fruits (29.35 percent), Gram Whole (29.34 percent), Meat (21.96 percent), Vegetables (18.19 percent), Chicken (17.17 percent), Beans (13.97 percent), Besan (12.54 percent), Pulse Gram (11.63 percent) and Milk (10.22 percent).
Decreased: Tomatoes (46.2 percent), Pulse Moong (24.59 percent), Condiments & Spices (14.78 percent), and Onions (7.75 percent)
NON-FOOD
Increased: Electricity Charges (56.20 percent), Liquefied Hydrocarbons (42.05 percent), Motor Fuels (34.86 percent), Washing Soaps/Detergents/Match Box (18.20 percent), Woolen Readymade Garments (15.63 percent), Cleaning & Laundering (15.44 percent), Hosiery (14.62 percent), Solid Fuel (14.02 percent), Woolen Cloth (13.74 percent), Motor Vehicles Accessories (13.34 percent) and Furniture & Furnishing (12.54 percent).
- Main contributors to month-on-month and year-on-year percentage changes in the Wholesale Price Index (WPI) are given below;
MONTH-ON-MONTH: Top few commodities which varied from the previous month are given below:
Increased: Jowar (14.19 percent), Fibre Crops (11.17 percent), Cereal Flour (6.59 percent), Bajra (6.04 percent), Chemicals (3.71 percent), Wheat (3.32 percent), Milk (3.29 percent), Pulses (2.76 percent), Quilts (2.39 percent), Eggs (2.27 percent), Motor Spirit (2.18 percent), Diesel (2.14 percent), Fertilizers (1.87 percent), Kerosene Oil (1.73 percent), Maize (1.73 percent), Fruits (1.43 percent), Sugar (1.30 percent) and Timber (1.08 percent).
Decreased: Spices (34.29 percent), Furnace Oil (11.05 percent), Potatoes (10.88 percent), Poultry (7.28 percent), Electrical Energy (1.84 percent), and Vegetables (1.25 percent).
YEAR-ON-YEAR: Top few commodities which varied from the previous year are given below:
Increased: Fibre Crops (79.77 percent), Kerosene Oil (53.01 percent), Oil Seeds (48.34 percent), Vegetable Ghee (46.35 percent), Cotton Yarn (45.36 percent), Chemicals (44.47 percent), Fertilizers (44.35 percent), Furnace Oil (44.07 percent), Steel Bar & Sheets (43.63 percent), Vegetable Oils (42.57 percent), Diesel (40.59 percent), Motor Spirit (36.13 percent), Electrical Energy (32.84 percent), Vegetables (25.62 percent), Bajra (25.42 percent), Pulses (24.23 percent), Cement (20.54 percent), Mobil Oil (19.58 percent) and Meat (19.46 percent).
Decreased: Spices (28.94 percent), Stimulant & Spice Crops (14.27 percent), and Maize (5.67 percent).
Stay Connected with ProPakistani
Get the latest business news, market insights, and economic updates wherever you prefer.
Add ProPakistani to Preferred Sources and see more of our stories in Google Search and Top Stories.